


Whether we’re looking at an IT support operation formally through our NOC operations consulting practice or informally as part of a new service engagement, we spend a lot of time inside others’ operations.
If we’re consulting on improvements, that means interviews with the staff, a look at the tooling, whatever data they can pull for us, and then a written assessment of what we found along with a roadmap.
The report looks different every time, but the finding mostly aren’t. After enough engagements you can guess a good portion of what you’ll write before the first interview, and the part that surprises people is that none of it is shockingly novel. The problems that hold NOCs back are mostly what you’d expect, but they’re also compounding, which is why an operation can go from workable to underwater without anyone making a bad decision you can point back to.
Ten of them come up often enough that we wrote them into a white paper. In part 1 of 2 here, we covers the five that sit on the path an alarm takes from the moment it fires to the moment somebody fixes it. Part 2 will cover the five underneath, which are the ones that determine whether any of this stays fixed after we leave.
1. Monitoring split across tools that can’t see each other
Throughout each of these, we’ll pull in examples from actual operations consulting projects we’ve done.
Disconnected monitoring tools is a systems problem we see all the time.
At one fiber-optic infrastructure provider we worked with, monitoring lived in Ubiquiti UISP and Calix SMx, but notifications went out over plain email. There was no unified view of anything anywhere. We watched engineers work through alert floods by hand, and we documented preventable power failures at critical fiber huts where the signal was sitting in the queue behind a hundred things nobody needed to see.
A digital banking platform had a cleaner-looking version of the same problem. Their operations center split monitoring between SLAB for applications and PagerDuty for infrastructure. Two good tools, both configured competently, but analysts still had to track and acknowledge across both, and nothing correlated between them, so an application symptom and its infrastructure cause showed up as two unrelated alerts in two places.
The cost people notice is the extra clicks. The cost that actually hurts the business is that no correlation is possible across a boundary the tooling doesn’t cross.
Consolidating onto a single platform is almost always the fix here, and we’ve historically gotten there with LogicMonitor or MicroFocus OBM (although there are other ways to accomplish this now).
The order matters more than whatever system you choose:
Inventory every place an alert can originate first, and that includes the informal ones: the inbox rule somebody set up in 2022, the syslog server nobody owns, the vendor portal that emails a shared address. Teams will routinely find two or three sources they’d forgotten.
Then migrate the highest-volume source, prove the pipeline works end to end, and move the rest.
Retire email as a notification path entirely once you have somewhere better for alerts to go, because as long as it exists, alerts will keep quietly routing around your new platform.
2. Alerts that never get correlated
This is close enough to the first problem that it often gets bundled in with it, but it’s really worth splitting out on its own.
Consolidation gets your events into one place. Correlation is what makes them usable once they’re there.
At a global tech company running cloud services we went into, the NOC was handling more than 50,000 events a quarter with no automated correlation. Every single one required manual acknowledgment. During major incidents we watched engineers try to piece together alerts from different systems that were all pointing at a single infrastructure failure, and critical issues sometimes weren’t escalated until after service was already affected.
The fiber provider we mentioned in the previous section had the “priority version” of this problem. With everything arriving as email, a minor event and a genuine outage looked identical on arrival. Staff couldn’t triage what they couldn’t distinguish.
Correlation work goes wrong when teams start with the clever rules. Do it in this order instead:
Baseline first. How many events arrived, how many became tickets, and how many of those tickets required a human to do anything. That last number is the one that matters, and most teams have never calculated it.
Suppress the pure noise. Informational traps, flapping thresholds, the device that reports its own health every five minutes. This alone often removes a third of the volume and it carries almost no risk.
Build topology-based correlation next. If an upstream device is down, everything behind it should roll up into that incident rather than generating its own.
Then add time-window grouping for events that are related but not topologically linked.
Re-baseline against step one and put the number in front of leadership.
At the tech company, filtering the noise and grouping related alerts into single incidents gave engineers a queue they could actually work. At the fiber provider, we used LogicMonitor's correlation capabilities to group related events automatically, which gave their staff their first clear view of what needed attention right now.
3. Incident management scattered across three systems (or missing entirely!)
The banking platform ran incident management across Salesforce for case management, SLAB for application alerts, and PagerDuty for infrastructure notifications. During a critical incident, people lost minutes deciding which system to use. Some incidents opened a Salesforce case automatically, others needed manual logging in PagerDuty, and handoffs were a constant source of confusion about what had already been done.
What bothered us most in that assessment wasn’t the tooling. It was that they had no way to measure first-level resolution, so they couldn’t tell how many incidents their frontline staff were closing on their own. They knew the process was broken, but they had no way to locate the break.
The fiber provider was further back than that:
No formal incident management system existed.
Email chains and verbal handoffs, with delays and missed escalations visible throughout their incident history
No ability to measure mean time to acknowledge or mean time to resolution because there was nothing to measure from.
A real ITSM platform solves this, and ServiceNow is where we land most often.
The advice we always give before you buy anything: write down your priority definitions and your escalation criteria first, on paper, and get the team to agree on them.
The most common way an ITSM rollout underperforms is that the tool gets configured before the process exists, so the platform ends up encoding whatever people were already doing informally.
Turn on first-level resolution tracking from day one. It’s the metric that tells you whether your tier 1 is a real support layer or a routing desk with a nicer title.
4. Runbooks nobody trusts
Runbook problems are tricky and insidious because they often look like documentation problems and behave like culture problems.
At the banking platform, the runbooks hadn’t been updated in months despite meaningful infrastructure changes. Staff had stopped opening them, which is the rational response to documentation that no longer matches the network. We watched different engineers handle identical incidents in completely different ways. During one major incident, that inconsistency added roughly two hours because the engineer on duty didn’t know about a workaround a colleague had used successfully the week before. Different things in different peoples’ heads, and best practices trapped person-to-person.
The fiber provider had exactly one procedural runbook for handling outages and most of the team didn’t know it existed.
Three things were true in both places and we see this all the time with documentation. The runbooks weren’t being updated as the environment changed, they weren’t easy to reach in the middle of an incident, and nothing in the process required anyone to use them.
You need to fix all three, and fix them in that order.
Make runbook review a required gate in your change process, so a change that alters the environment can’t close until the affected procedure is updated.
Move the library into the ITSM platform where it’s searchable from any terminal, rather than a wiki or PDF nobody has open at 3 a.m.
Then run drills, where engineers work a simulated incident using only the documentation. Drills are the only reliable way we know to find out which runbooks are quietly wrong, and they double as the most useful training you can give a new hire.
One caution here! Don’t set out to write two hundred runbooks. Cover your highest-volume alarm types, get those trustworthy, and expand from there. A wrong runbook costs more than a missing one, because it burns the credibility of the whole library.
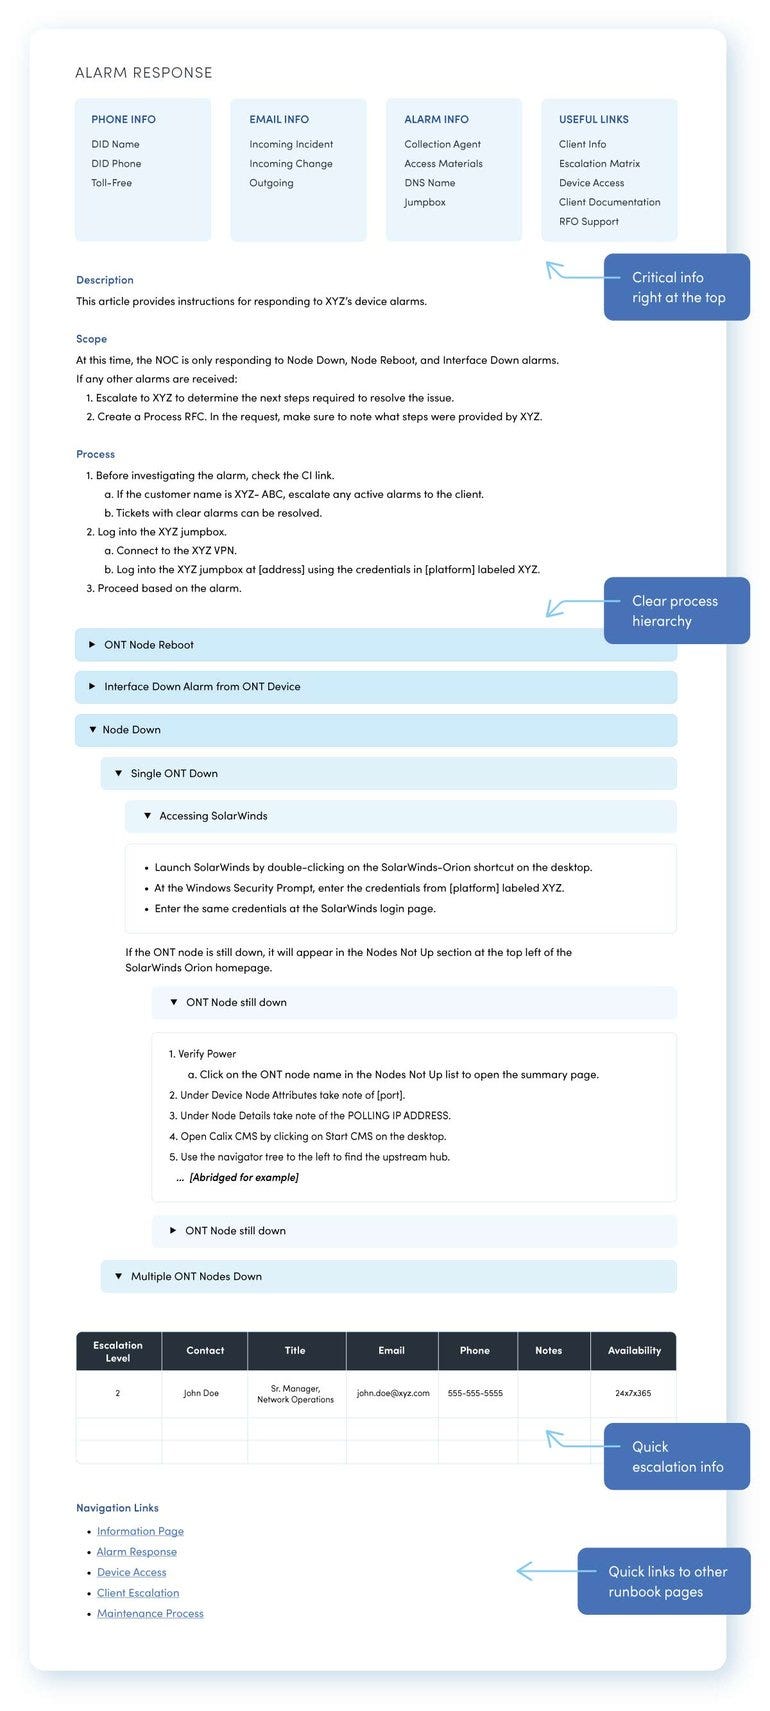
Here’s the general template for our runbooks/knowledgebase articles. Read our full guide to NOC runbacks for more depth.
5. Manual work sitting where automation belongs
At that tech services provider, event acknowledgment and ticket creation were entirely manual. That works until it doesn’t! During outages, when volume spikes and the work matters most, incidents piled up faster than the team could process them, and we found critical incidents sitting unattended for periods nobody would defend.
The fiber provider’s analysts were manually acknowledging and triaging across PagerDuty and SLAB, spending hours on redundant and low-priority alerts while real problems waited in the queue.
Both cases responded well to well-tuned automations. Automating acknowledgment, ticket creation, and initial triage at the technology company cut average alert resolution time by 70%. Moving the fiber provider onto LogicMonitor’s automated platform reduced initial response times by as much as 60%.
If you’re starting from a mostly or fully manual operation, the automation sequence we’d recommend is alert acknowledgment and ticket creation first, because it’s the highest volume and the lowest risk.
Auto-resolution for short-duration incidents that clear on their own comes next, and it removes a surprising amount of low-value work while still capturing the data.
Alarm suppression during maintenance windows is third, and it's the cheapest win on this list. Almost nobody has it, and every NOC without it wastes hours a month chasing alerts caused by planned work. It’s the biggest piece of low-hanging fruit we see just about everywhere.
Be warned though — automating a broken process only gives you the broken process at higher speed. If your triage logic sends the wrong things to the wrong people, automation makes that happen faster and more consistently. Fix the flow first, then automate it.
What’s coming next
Everything above lives on the incident path. You can fix all five and still watch the operation slide backward within a year, because what holds them in place is underneath.
Part two will cover those five: a CMDB that doesn’t match the network, changes the NOC can’t see, the absence of performance data, skill concentrated in people you can’t afford to lose, and a NOC that’s cut off from the teams it depends on. Those are the ones that decide whether the work in part one survives.
If any of this sounds like your operation, know that all of these issues are extremely common. Our NOC operations consulting practice uncovers everything holding your operations back and then gives you the steps we suggest taking to unlock better performance. Every engagement opens with a focused assessment of your specific environment and ends with a detailed report and recommendations, with additional implementation support if you need it.
Contact us and we’ll set up a discovery call to learn more about where you’re at.
📄 The full white paper, The NOC Improvement Playbook: 10 Common Problems We See and Solve in Our Consulting Engagements, covers all ten problems along with several more we see regularly, and closes with a self-assessment you can run against your own operation.

About INOC, a service of Xerox IT Solutions
INOC is an ISO 27001:2022 certified 24×7 NOC and an award-winning global provider of NOC Lifecycle Solutions®, including NOC support, optimization, design, and build services for enterprises, communications service providers, and OEMs. INOC solutions significantly improve the support provided to partners’ and clients’ customers and end users.
INOC assesses internal NOC operations to improve efficiency and shorten response times, and provides best practices consulting to optimize, design, and build NOC operations, frameworks, and procedures. Proactive 24×7 NOC support is provided with several options, including North America, EU, or APAC only or global integrated NOCs. INOC’s 24×7 staff provides a hands-on approach to incident resolution for technology infrastructure support.
Learn more about our NOC support and NOC operations consulting services. Get in touch to start the conversation. We’d love to talk NOC.
Disclosure, I work on operatex.dev, an incident agent.
The correlation ordering is the part most teams get backwards, jumping straight to clever rules before establishing the baseline of how many events actually needed a human means you can't prove the fix worked, you're just guessing it did. And the runbook point about a wrong runbook costing more than a missing one is underrated, stale documentation doesn't just fail to help, it actively burns fifteen minutes of an engineer's trust before they give up and start from scratch.